Real Estate Investar is excited to announce the launch of a new feature to Investar Search where median listing price graphs at the property type or suburb level are displayed if there is not enough data available at the bedroom count level.
Investar Search currently displays the median listing price growth for the past 6 years by the property type, bedroom count and suburb. This data is displayed next to each listing result if enough data is available for all 3 criteria.
NEW INVESTAR SEARCH FEATURES
Median Listing Price Graphs
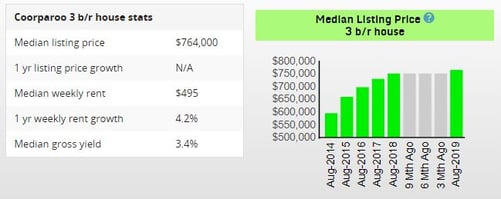
Real Estate Investar currently displays the median listing price growth for the past 6 years by the bedroom count, property type and suburb. This graph is displayed within each property listing result if enough data is available for all 3 criteria.
Median Listing Price - 3 bedroom houses located in the suburb of Coorparoo

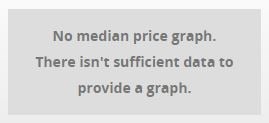
If there is not enough data, no graph will be displayed.

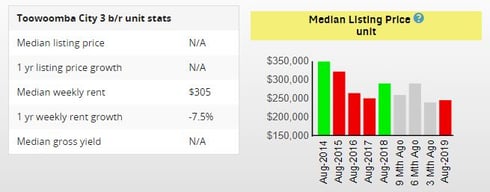
With the new changes, if there is not enough data at the bedroom count level, the median listing price for the property type in the suburb will be displayed instead.
Median Listing Price - units located in the suburb of Toowoomba City

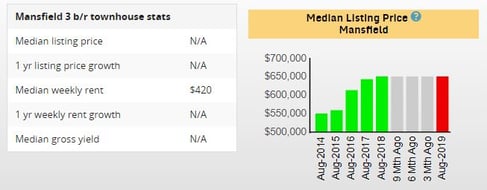
Finally, if there is still not enough data at the property type level, the median listing price for the suburb (includes all property types and bedroom counts) will be shown instead.
Median Listing Price - suburb of Mansfield

We hope members will benefit from this new feature and we really hope they help with your market research. If you have any questions or would like to provide suggestions for future product enhancements, please email us at info@realestateinvestar.com.au.
.png)


.png?width=229&height=115&name=RE%20Investar-Logo-MRI_Colour%20web%20229x115px%20(1).png)