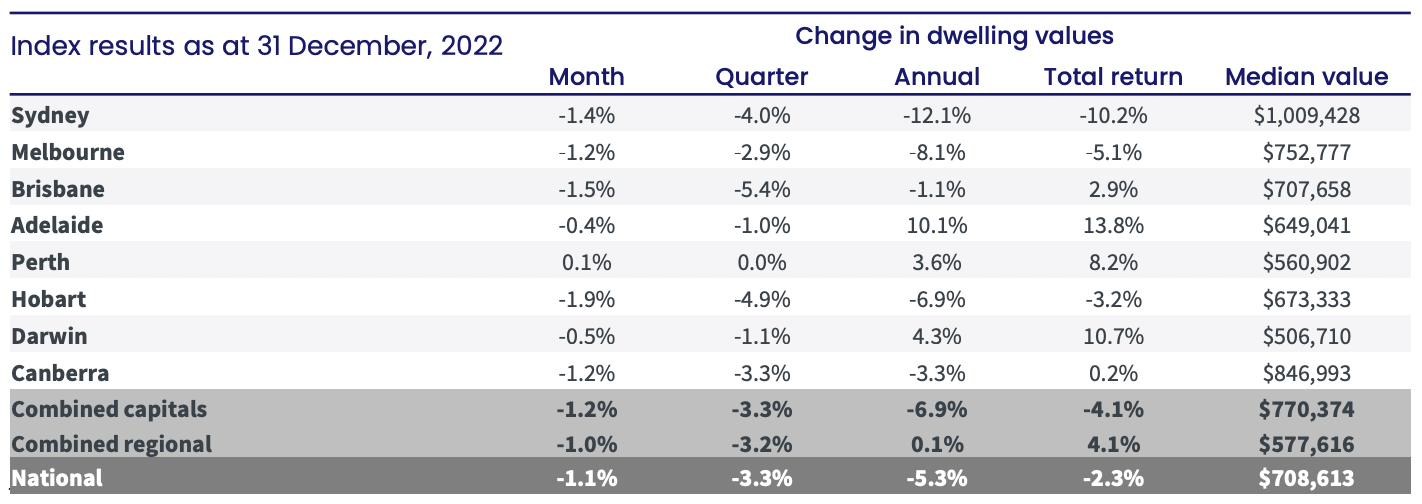
Home prices across the country have ended the year down 5.3%, the largest decline since 2008.
According to CoreLogic, values fell another 1.1% in December, dragged down by the large capital cities. Last month, values declined 1.4% in Sydney, 1.5% in Brisbane, 1.2% in Canberra and Melbourne, while Hobart experienced the largest fall of 1.9%. Perth was the only major capital city to record a small 0.1% gain for the month.

Source: CoreLogic
Despite the downturn across many areas of the country, housing values generally remain well above pre-COVID levels. Across the combined capital cities, values are 11.7% above where they were at the onset of COVID (March 2020), while values across the combined regional markets are still up 32.2%.
On an annual basis, Sydney (-12.1%) and Melbourne (-8.1%) experienced the largest declines to close out the year. Hobart (-6.9%), the ACT (-3.3%), and Brisbane (-1.1%) also recorded an annual drop in housing values, while Adelaide (10.1%), Darwin (4.3%) and Perth (3.6%) all ended the year marginally higher.
CoreLogic’s research director, Tim Lawless, said home prices have fallen away dramatically compared to the start of the year.
“Our daily index series saw national home values peak on May 7, shortly after the cash rate moved off emergency lows,” Mr Lawless said.
“Since then, CoreLogic’s national index has fallen 8.2%, following a dramatic 28.9% rise in values through the upswing.
“The more expensive end of the market tends to lead the cycles, both through the upswing and the downturn. Importantly, recent months have seen some cities recording less of a performance gap between the broad value-based cohorts.
“Sydney is a good example, where upper quartile house values actually fell at a slower pace than values across the lower quartile and broad middle of the market through the final quarter of the year.”
Although housing values across the combined regional areas of Australia were virtually unchanged over the year (+0.1%), results were more mixed across the states. Annual falls across Regional NSW (-2.7%) and Regional Victoria (-1.3%) offset annual gains across the remaining regional markets.
“Regional South Australia has been the stand out for growth conditions over the past year, with values up 17.1% through 2022,” Mr Lawless said. “
The well known Barossa wine region led the capital gains with a 23.0% rise in values over the calendar year.”
Stock and sales volumes remain low
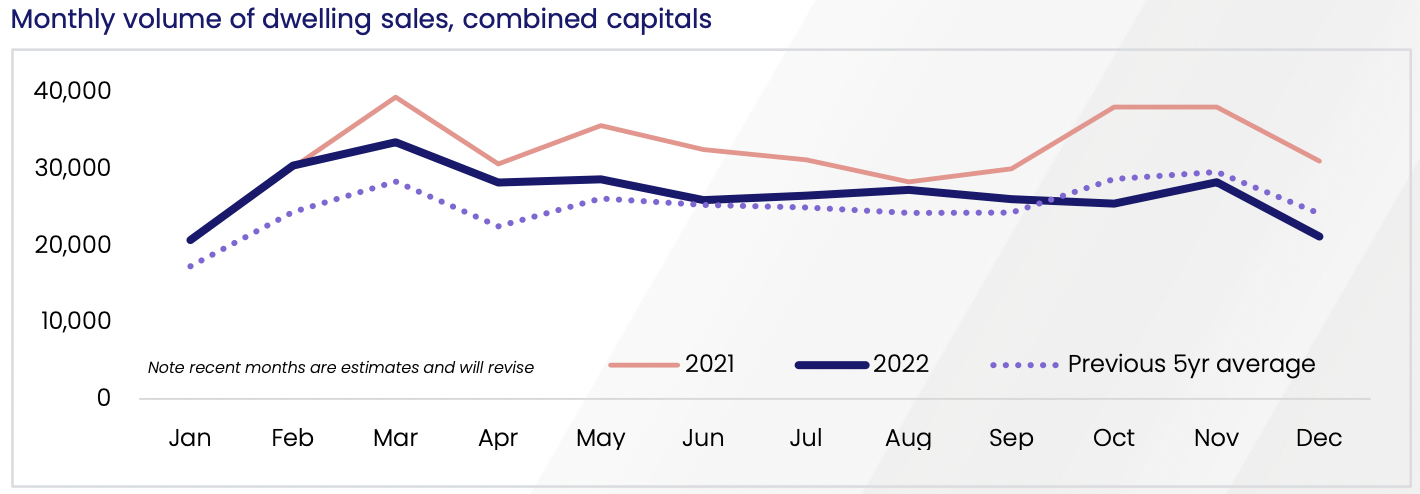
Advertised supply levels ended 2022 substantially lower than last year and well below the previous five-year average.
The lower than normal flow of fresh listings added to the market over the past few months has been a key factor keeping overall inventory levels low. New capital city listings added to the market over the past four weeks were -30.6% lower relative to the same period in 2021 and almost -10% below the previous five-year average
At the same time, sales volumes have also fallen away dramatically.
“The balance between the flow of new listings and number of home sales will be a key trend to watch through early 2023,”
“We typically see a seasonal surge in the number of new listings added to the market from early February through to Easter." Mr Lawless said.
“If this seasonal pattern plays out over the coming months against the back drop of higher interest rates and a further drop in buying activity, we could see housing prices responding negatively as advertised supply levels rise and vendors are forced to discount their prices more substantially.”

Source: CoreLogic
Rents begin to slow down
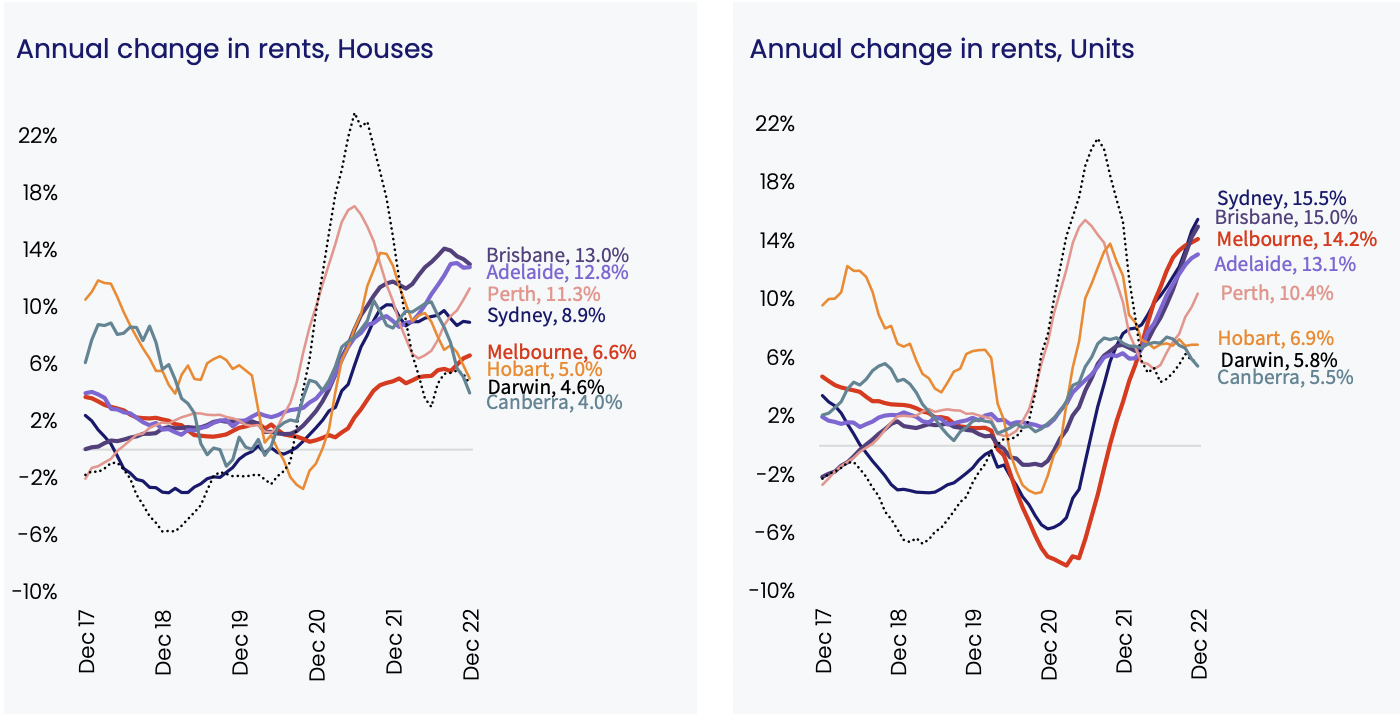
Rents across the country increased a further 0.6% in December and finished up 10.2% over the calendar year. However, the rate of rental growth is now starting to slow down across many locations around the country.
Rents rose across every broad region and housing type across the country over the past year, ranging from a 4.0% rise in house rents across the ACT to a 15.5% increase in Sydney unit rents. While housing values have been influenced by interest rates, rental market conditions have been more closely linked to demographic trends through COVID.
Fewer people per household through the pandemic, and more recently the strong return in overseas migration, has added substantially to rental demand. Over the coming year, high rental demand is most likely to be concentrated in Sydney and Melbourne, which have historically accounted for around two-thirds of overseas migrant arrivals.
“As renters face worsening affordability pressures, it’s logical to expect more rental demand to transition towards higher density options, where rents are generally more affordable, or for rental households to maximise the number of tenants in a rental dwelling,” Mr Lawless said.

Source: CoreLogic
Outlook for 2023
According to Mr Lawless, house prices are expected to continue to decline over the next 12 months as higher interest rates continue to weigh on buyers' borrowing capacity.
Mr Lawless said the pending surge in fixed-rate loan refinancing is just around the corner and represents a significant risk to the property market. The latest Financial Stability Review from the RBA noted around 35% of outstanding housing credit is on fixed terms, with around two-thirds of these loans set to expire in 2023. Most of these borrowers will be seeking to refinance to variable mortgage rates that will be 3 to 4 percentage points above their origination rate.
There’s also likely to be a rise in the number of newly listed properties, as pent-up supply flows into the market. The flow of new listings has been abnormally low through the second half of 2022, as prospective vendors postponed or reconsidered their selling decisions in light of worsening housing market conditions Mr Lawless said.
“As interest rates peak and inflation eases, housing values are likely to stabilise, however a broad-based rise in housing values would be dependent on interest rates coming down, or on other forms of stimulus,” he said.
“Historically, a new phase of growth in housing values has been associated with a catalyst or combination of stimulatory events such as falling interest rates, easing credit policies, or favourable government policy outcomes (such as first home buyer incentives).
“Easing credit policies could take the form of a reduction in APRA’s serviceability buffer (currently 3 percentage points, previously 2.5 percentage points), which could reflect an acknowledgement that mortgage rates aren't likely to rise much further following the recent adjustment from record lows.”
.png)


.png?width=229&height=115&name=RE%20Investar-Logo-MRI_Colour%20web%20229x115px%20(1).png)